(Here I'm using SQL 2005 on Windows 2003)
1) Start Performance Monitor > (start > run > type 'perfmon' [enter])
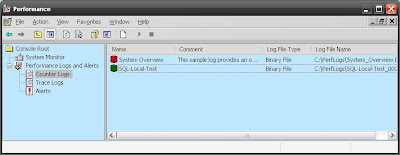
2) Create a counter log as shown below >

3) Add Counters for whatever you want to monitor. >
I've chosen Memory, SQL Wait Statistics, PhysicalDisk and Processor.
 Start the Counter log
4) Prepare Tracing >
Start SQL Profiler (management studio > tools > sql server profiler)
Start a new trace (file > new trace)
On the 'General' tab, specify the Trace name and select 'Save to file'.

On the 'Events Selection' tab, select the sql events to record in the trace.
Column Filters can be used to restrict the data recorded.
In the example here I have added 'DatabaseName' as a column and have filtered to only record data from one db. >

5) Run the trace >
Click 'Run' to start the trace.
The trace appears in real time, capturing SQL Activity as shown here >

NB : In another window, i ran some pre-prepared queries as a test for this demo. Some SELECTs, random CROSS JOINS (to return large recordsets) and a CURSOR for good measure :)
Stop the profiler and then the counter log when finished.
6) Set up the data comparison >
Open the profiler trace (file > open > trace file > (select file saved in last step).
Import the trace data (file > import performance data > (select .blg file saved from perfmon).
The 'Performance Counters Limit Dialog' selection window is then displayed.
Use this to restict the comparison to objects of counters eg 'Page Faults/Sec' within Memory.
(Select OK when finished) >

7) The Results >
Profiler now combines the standard trace window at the top (sql statements recorded etc) with the performance monitor graph at the bottom. Basicly, it correlates the two sets of data by timestamp to assist with locating performance issues.
By clicking on a statement in the trace window, the highlighted bar moves to the point of the timeline so we can see processor, memory etc at that point in time.
Similarly, by clicking the timeline, the sql command executing at the time is highlighted.

1 comment:
THANKS VERY MUCH!!!!!! HELPED ME A LOT IN MY ASSIGNMENT!
Post a Comment